

Is valuation of Netflix justified?
Is valuation of Netflix justified?
Streamers # 2 | How much you're worth to streaming apps!
Welcome back to Money Carnival. If you are new here, click below to bring carnival to your home. We do business and industry breakdowns for technology companies across the globe.
In this edition of streamers, we’ll deep dive into Netflix Numbers and will also try to see if the valuations are justified. In case you haven’t checked, Click to read the 1st part of Streamers where we have discussed the timeline of competitive intensity of industry, what made Netflix successful and it’s future opportunities.
Valuation is subjective and it highly varies on the story that you believe in for the company. Any change in story will change the assumptions in key variables and will change the valuations and this difference in everyone’s story is what’s known as variant perception.
Let’s breakdown the key variables for the company that will help us make a well informed decision.
1. Revenue Drivers
As we discussed in previous edition, Netflix has grown steadily over 25-30 % over the past decade with little bumps here and there.
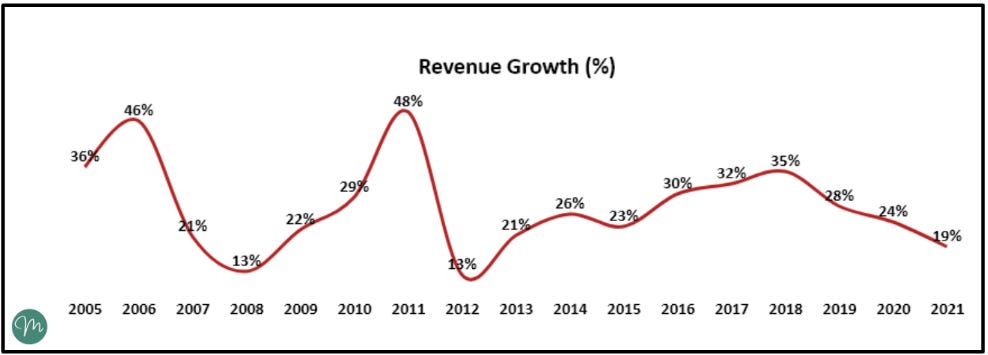
To drill it further, we need to check the components of this revenue. Netflix (used to) earns revenue from 2 products, their streaming subscription and DVD-by-mail service. DVD service has come down from 30% of overall revenue share in 2012 to less than 1% of overall revenues.
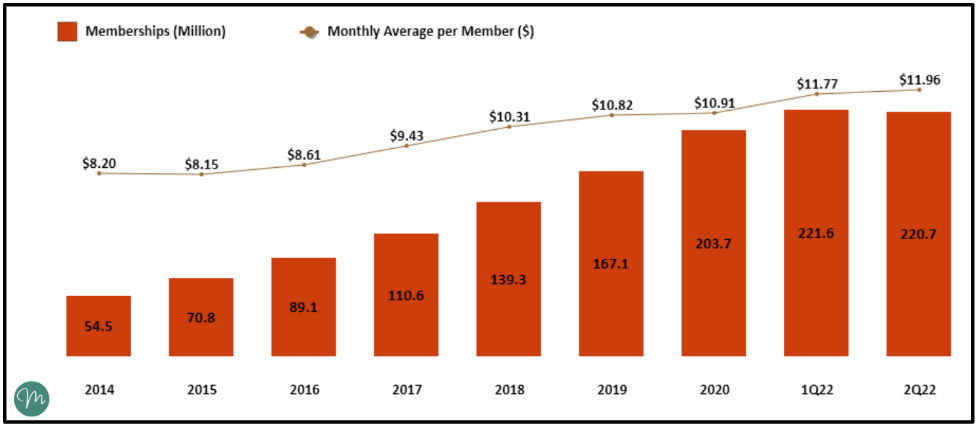
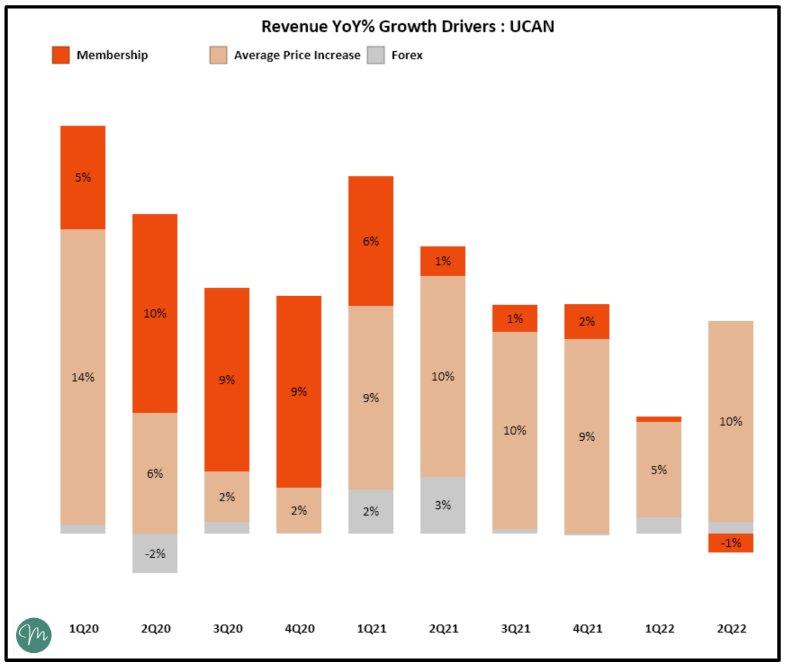
To segment it further, there are two drivers of revenue growth. Either company has to increase the number of subscribers or increase the pricing.
Revenue = Number of Subscribers * Average Price Per Member
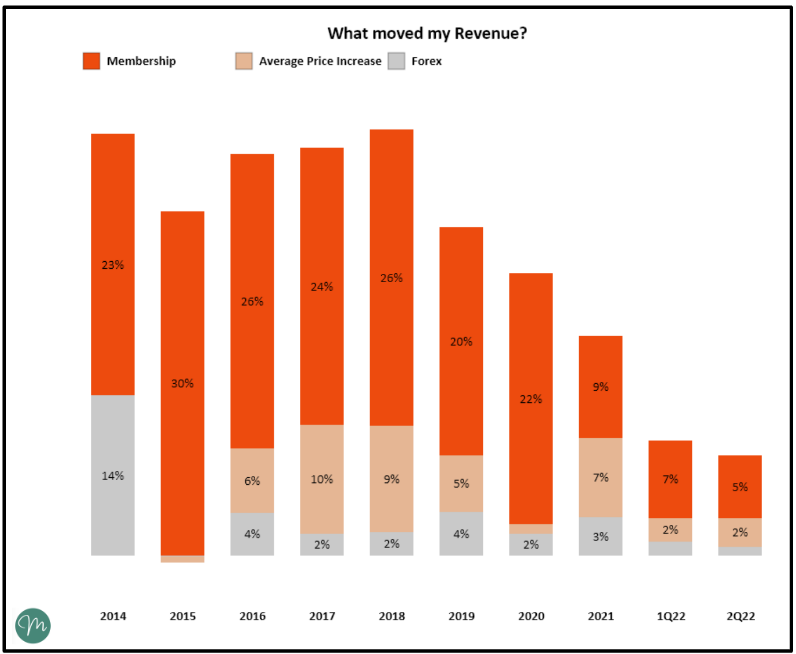
Quick Note on How to read the above chart : This is a breakup of YoY% growth by membership vs Pricing. For e.g. In 2021, Out of Total YoY% growth of 19%, 9% comes from Membership Growth, 7% comes from Increase in Price, 3% of growth comes from favorable forex.
Membership growth has been major driver for Netflix over the years with consistent rise in prices. Membership growth has slowed down by mid FY21, part of the reasons are Covid restrictions lifting off, rising competitive intensity and macro economic challenges, which created a Lollapalooza Effect for Netflix and challenged them to revise their guidelines and have them start working on several other opportunities like ad-tier and paid-sharing initiatives.
To dig deeper, we’ll also have to look at regional breakdown.
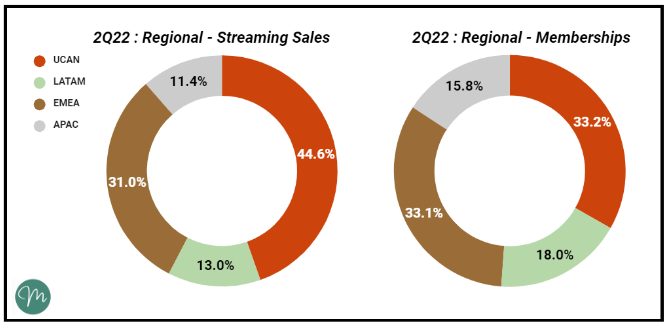
1.1 US & CANADA (UCAN)
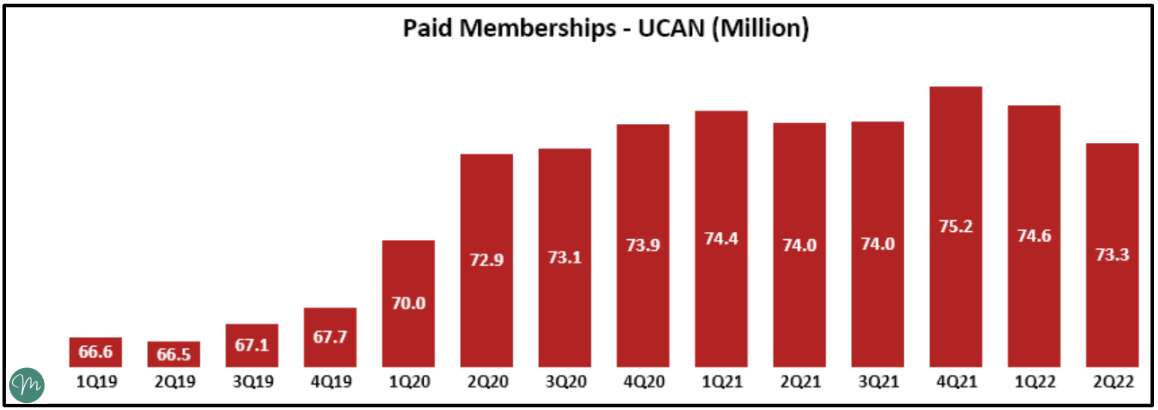
Membership growth has been stagnant in US & Canada region since couple of years and this is expected to remain so because of the saturation in market. To put this in perspective, US & Canada combined have a population with internet of 325m (~90% internet penetration). Considering a family of 3, brings potential members to 108m, which suggests around 65-70% of potential users already have Netflix. Another perspective to look at this is through historical Pay-TV subscribers, it was 104m in 2010 (72m in 2020), which also suggests a similar picture of saturation in this market.
Increase in price is the major driver in US market since last few quarters and could possibly remain so in future. In latest quarter (2Q-22), Monthly average price per member has reached $16 (7% hike since last quarter). Biggest challenge in US / CA for Netflix will be to reduce churn with increase in pricing and increasing competitive intensity.
1.2 Europe, Middle-East & Africa (EMEA)
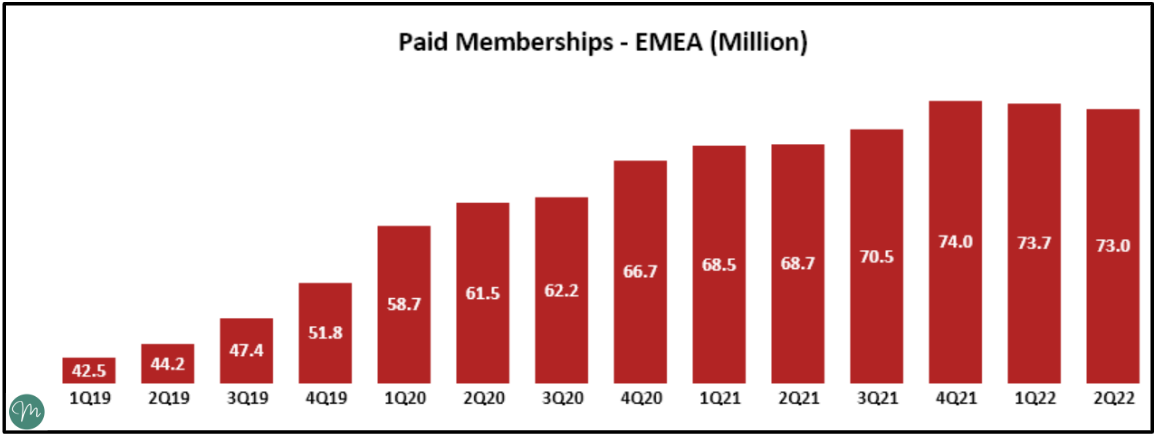
EMEA has seen stable 3-5% QoQ Growth since couple of years with stagnant growth in last 2 Quarters. Reason could be attributed towards Europe economy crisis with rising inflation worries and subscriber loss in Ukraine due to war. To get addressable market assumptions, EMEA region has 900m Internet users (600m Europe + 300m Africa) Considering a family of 3, brings potential members to 300m, which suggests there’s enough headroom to grow (~75% of market), especially in Africa where growth can be higher once internet penetration will increase.

EMEA growth was primarily driven by memberships with minimal price hikes. In latest quarter (2Q-22), Monthly average price per member has reached $11.2 (-3% since last quarter). EMEA business is going through challenges due to several economic macro reasons and could possibly stay like this for a while. Long term theory can be based on large headroom in member growth in Africa and Price increase in developed Europe once the macro conditions improve.
1.3 Latin-America (LATAM)
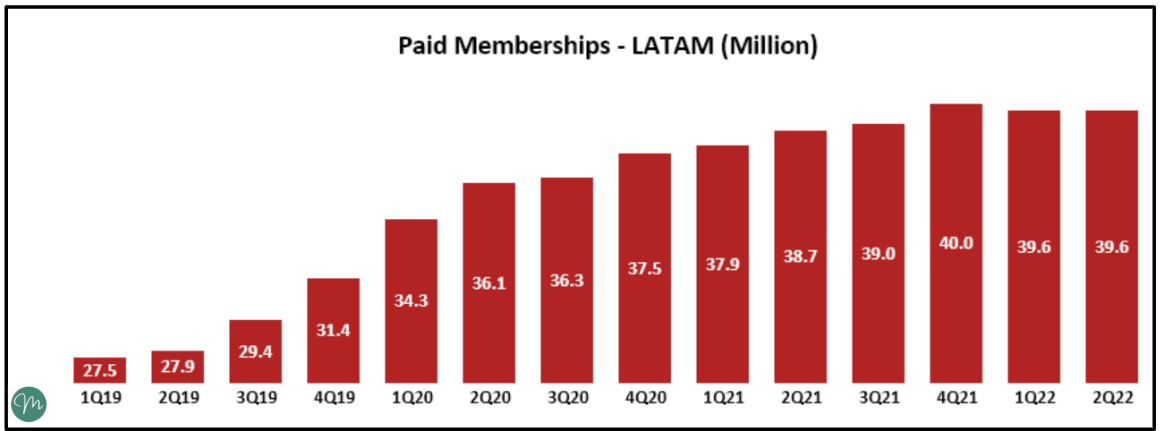
Similar to US / CA, membership growth of LATAM has also going through a rough patch, however, reasons could be different. Netflix is working on increasing content relatable to region and also trying to monetize the password-sharing revenue leak.
To get addressable market numbers, LATAM has ~400m Internet users. Considering a family of 3, brings potential members to 139m, which suggests there’s enough headroom to row (~70% of market). LATAM also has around 60% internet penetration, which is expected to rise with time.
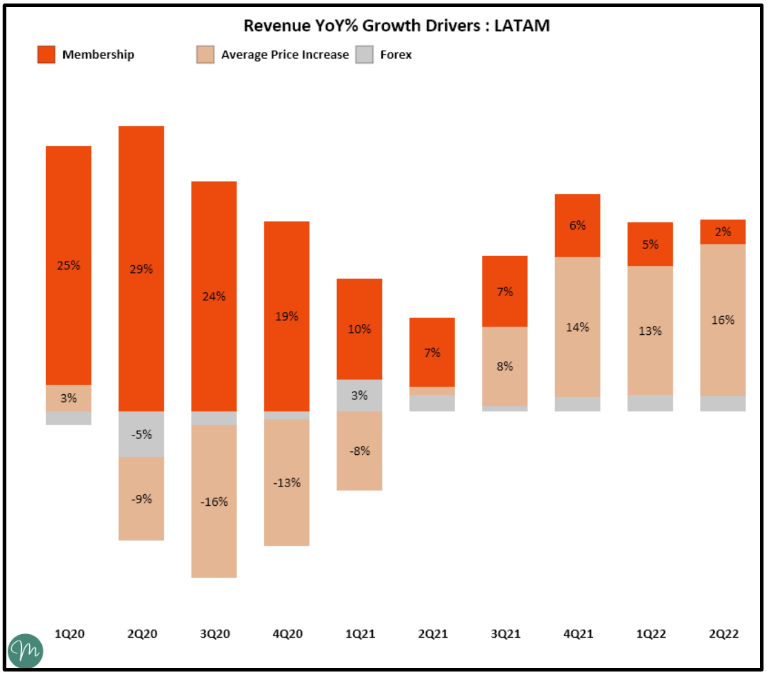
Netflix had to do price cuts (to reduce churn) in LATAM in FY20 which are now reached to previous levels . Currently monthly average price per member is $8.7 (significant discount to US / Europe Pricing) and they have always been in $7- $8 range since start. Last year has been primarily driven by price increase with minimal subscribers growth. Increase in relatable content combined with ad-tier can improve the subscriber growth in future. Additional revenue from currently shared accounts can improve the pricing in region.
1.4 Asia Pacific (APAC)
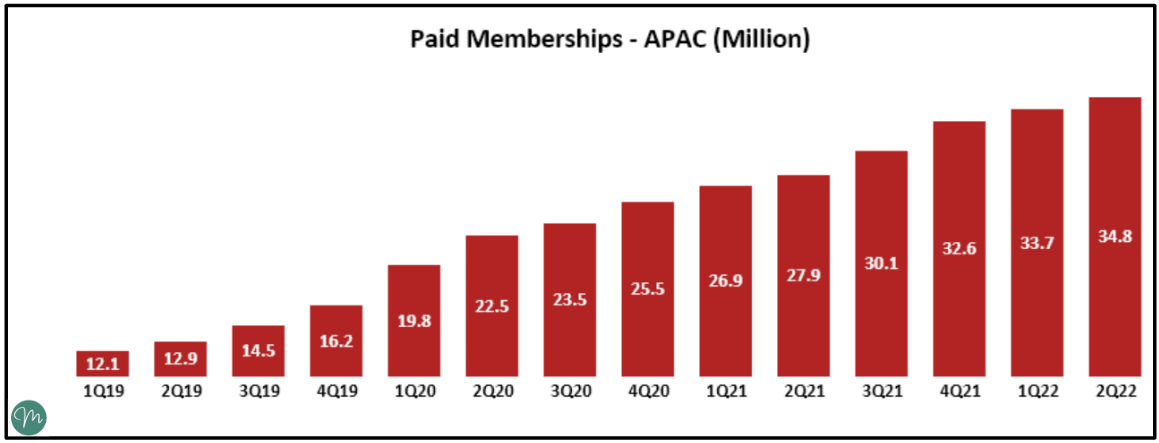
On low base and huge addressable market, APAC has consistently shown higher growth than any other region. However, Netflix has expected much more from APAC considering their rival Disney + has gained a majority of Indian Market Share with it’s Hotstar acquisition.
To get addressable market numbers, APAC ex. China has ~1500m Internet users. Considering a family of 3, brings potential members to 603m, which suggests there’s huge headroom to row (>90% of market). India is the biggest market in APAC region, where Netflix is trying to grow, for which they are also planning to bring Ad-Tier (Cheaper pricing with ads) by FY23, essentially playing catchup with Disney+.
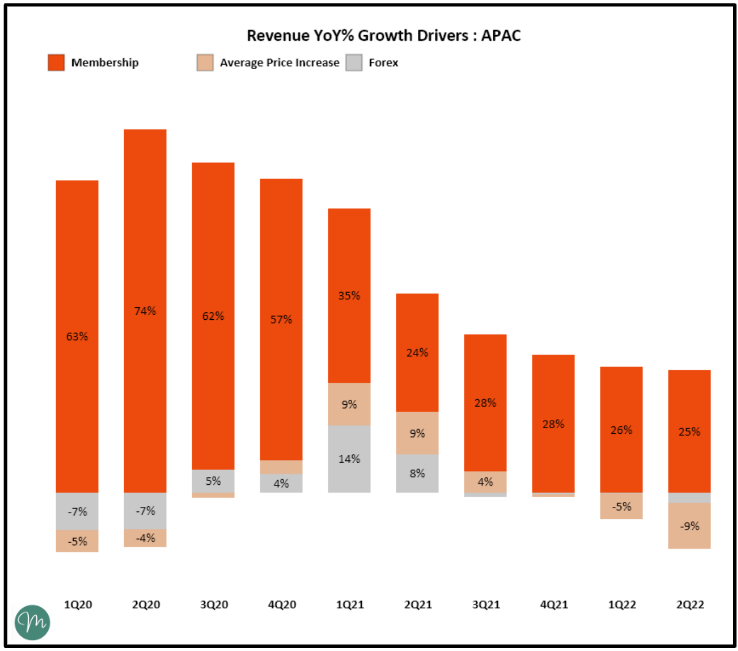
APAC is also subscriber volume driven growth model. Considering strong dollar against most currencies in APAC, Netflix had to take price cuts (-4% QoQ) since 4Q’21. Currently monthly average price per member is $8.8 (significant discount to US / Europe Pricing and similar to LATAM) and they have declined from historical $9 - 9.7 range. Similar to LATAM, Increase in relatable content combined with ad-tier can improve the subscriber growth in future. Also, improvement in macro conditions and currency stability can improve the pricing in region.
Side Note on Addressable Market, these are just assumptions based on the current population numbers / internet penetration numbers of regions sourced from statista.com . Other factors like per person income levels, internet speed, govt. regulations could have an impact on the market size of industry.
2. Expenses
Now that we got the idea about the areas from where revenue growth can come, let’s move to second key factor which is expenses.
2.1 Sales & Marketing Costs
Netflix considers the Amortization of Content amount as a cost of sales with the other software / hardware cost it takes to serve a new customer. Both Sales & Marketing cost are variable in nature and generally linked to the growth of members.

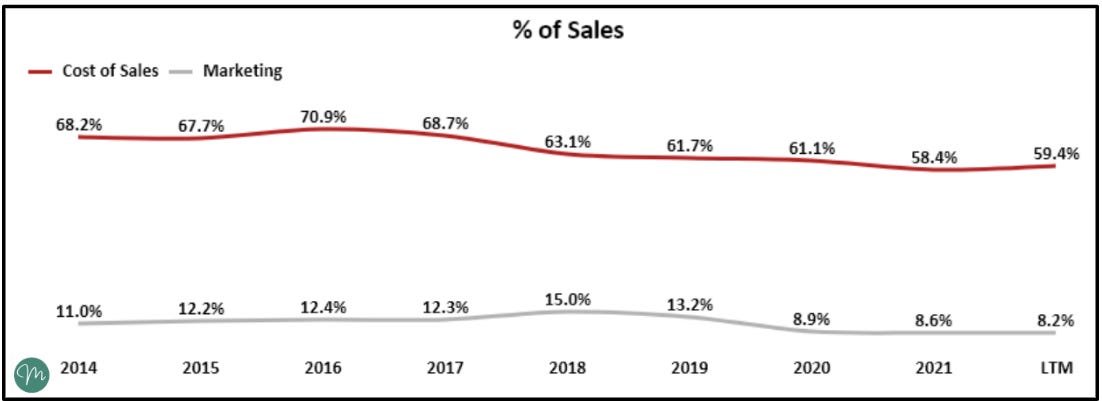
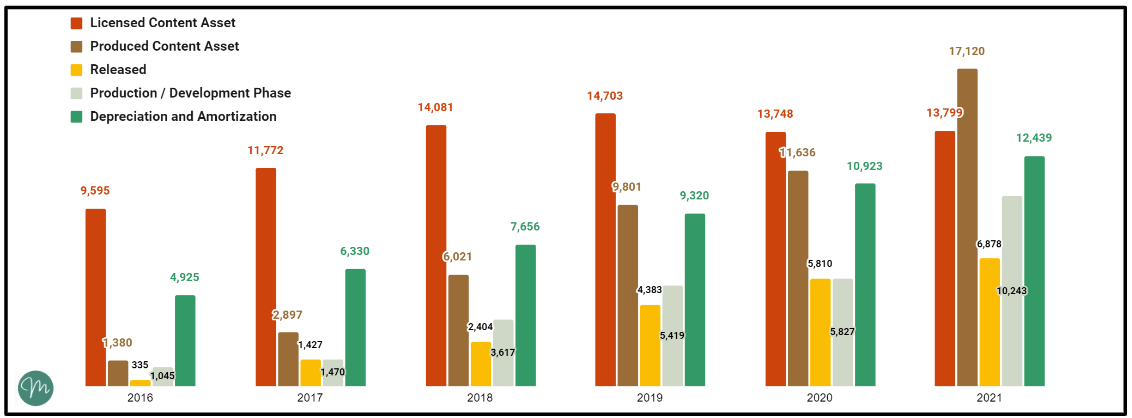
If Netflix will be able to increase average price per member over time, Marketing and Software cost will come down as a result, to drive profitability. A large chunk of Cost of sales comes from Amortization of Content Assets. Amortization of content depends on the type of content (Licensed or Produced) and is linked to the content spent by company. Part of the reason for slowed cost of sales growth is Netflix moving towards producing rather than licensing the content which allow them to amortize content at slower pace.
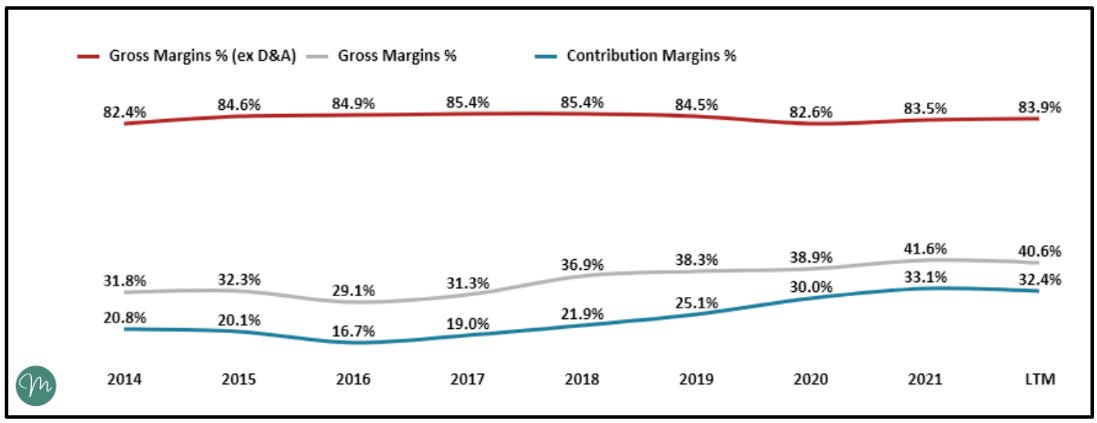
Gross Margins % (Profit net of cost of sales) and Contribution Margin (Profit net of variable costs) are inching higher, shows the improving economics of business. With increase in average price per member, this trend of improving margins could continue.
2.2 Tech / Development & Admin Costs

Tech / Development costs are related to headcount, technology and general costs that are being spent on improving the software and research being done for future developments. Over years, these costs get reduced for mature software companies which was the case for Netflix couple of year ago, however, with challenging environment, RnD expense could be expected to remain flat or increase as Netflix is spending on several things like ad-tier, improving recommendations for regions, paid-sharing and Gaming.
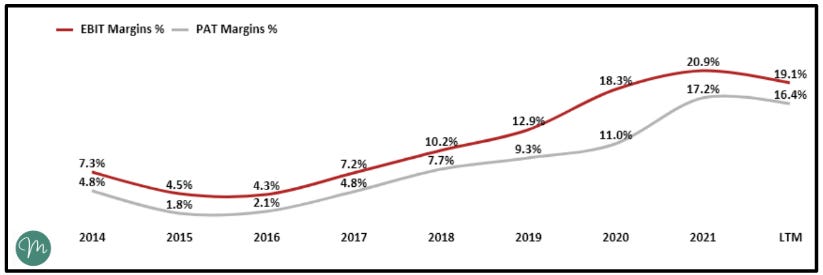
Netflix don’t provide further breakdown of admin / general costs, but over the years it has been in a 4-5% range as a % of sales which has led to a decent EBIT and PAT Margin increase over the years as shown below.
3. How much Netflix spend to get new subscribers?
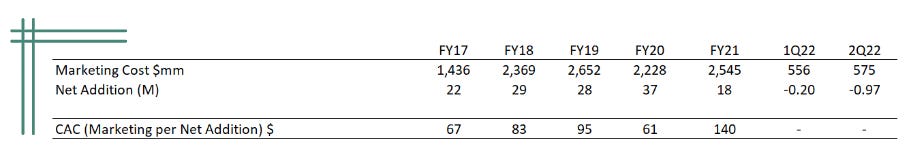
You might remember the discussion on CAC we had in one of our previous write-ups. CAC is a term for Cost that company spend to acquire each paid member. Netflix don’t directly provide the number so we’ll just have to make our way out of it, keeping in mind this activity is just to get a ballpark number and get the trend.
Looking at marketing cost per gross new member is ideally I was looking for but we don’t have gross addition of members outside US, hence we are looking at net addition numbers. Netflix in FY21 spent 140$ on marketing per new member (net of lost members) which is higher than historical numbers because of decline in net addition of subscribers.
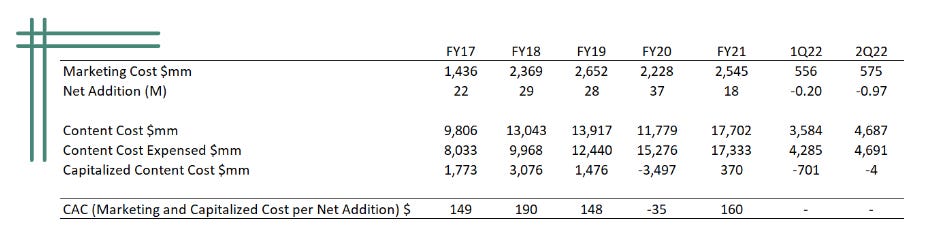
Additionally, we can also think of content which is being capitalized on balance sheet as the cost linked to getting new subscribers. However, since last few quarters, both the costs are getting closer or even out. Including the content cost, cost will be slightly higher to $160.
4. How much you’re worth to Netflix?
So Netflix Spends around 140-160 $ to get new subscriber and you might be wondering if it’s worth to spend the cost. Let’s find out.
Lifetime value for a customer can be determined by the Annual Average Revenue per Member which is driven by pricing plans. Currently at Jun’22, annualized average revenue stands at $143. Gross Margins are calculated as Revenues net of cost of sales which is basically the content cost which is being expensed. We also need to consider churn rate of members to adjust the value for the members leaving the subscription. This will give us a Lifetime value of customer as $202 in FY21 and $162 in 1Q22. These churn rates are mostly assumptions based on US churn rates provided by research firm Antenna.
There is also another caveat here. One might argue that cost spent on content is not getting used only to acquire new customers, It’s also to retain the existing customers. If we assume 75% of content cost is used to retain the users, margins on new customers will hype up to 85% which will increase our lifetime value to 415$ for FY21 and $308 in 1Q22.

To connect it together, LTV (Life time Value) considering higher margins is around 3x of CAC which implies Netflix earns per customer around 3 times of the amount that they spent to get that customer to sign up. As you might have already observed, few of the variables that will continue to drive these metrics are content spend, average pricing and churn rates of company.
5. Content Cost : Running on a treadmill?
Last piece of our missing puzzle : Content Cost.
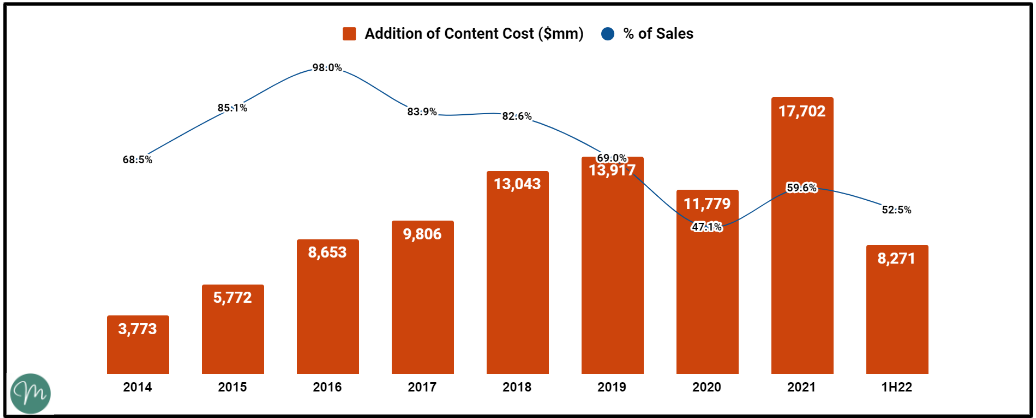
Netflix has spent plenty on content cost over the years aggressively to built a brand with the thesis running around economies of scale. It suggests as the revenues increases over time driven by membership growth and pricing, it will surpass the increase in content cost driving profitability.
There’s a decline in content spent on FY20 because of inability of some productions to sign contracts because of Covid restrictions. Even though spending in 1H22 is lower (52.5% of streaming sales), it will be interesting to see if Netflix will be able to control the costs further and still be able to grow at a decent pace or not ! The obvious risk to this is increasing intensity of competition.
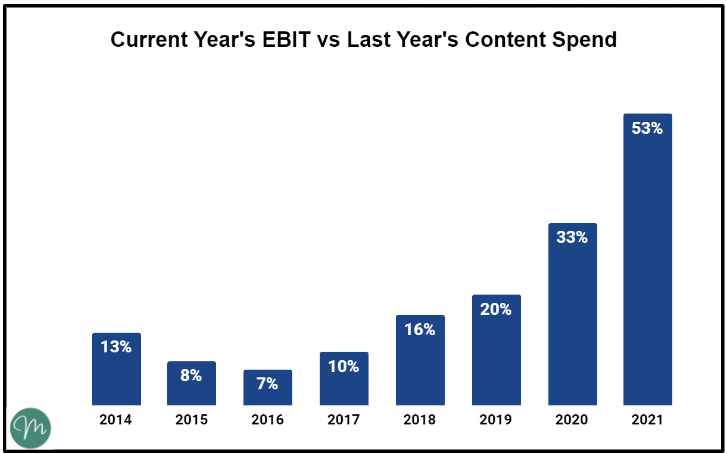
Another trend to look for is returns on incremental content spend. One of the way to look at it is current year’s earnings vs last year’s spending on content. For now, this seems to be a secular up-trend till FY21.
Connecting the Dots
Now that we have figured out the possible cases for each of the variable, let’s summarize to create a basic valuation model.
I’ll put up a sample DCF scenario where I have input the assumptions to get to the current price (Think of it like a Reverse DCF to see the assumptions that are priced in).
Check the template through the link below where you can make your own assumptions and get to your own valuations.
Based on the assumptions I took in above sheet, Netflix have to grew it’s revenue by 15% CAGR and EBIT by 22% CAGR (Implying EBIT Margins Increase from 21% to 28%) to justify the current price point.
<Terminal Growth Rate : 5% and WACC : 12% used for this calculation>
Whether the current valuations are attractive, justified or ridiculous, is something a investor has to decide based on the story you believe in. Let me know in comments what do you think about this ! Looking forward to hearing from you all.
If you’ve reached this far, Thank you for reading. In the next edition of streamers, we’ll discuss another major player in streaming industry and where does it stands with Netflix. Don’t forget to subscribe to get latest copy as soon as it’s published.
Happy to connect on Twitter | Multipie
Until then,
Stay curious, Keep healthy !


Supported Reading:
https://themoneycarnival.substack.com/p/the-streamers-1 - 1st part of streamers series, we focus on the timeline / phases of industry and rise of Netflix.
https://www.youtube.com/watch?v=1zSvixpnfE0 - Netflix creating games based on it’s shows and characters.
https://top10.netflix.com/- Really liked the site, worth checking out.
https://about.netflix.com/en/news/update-to-paid-sharing - Changes for LATAM users to crack password sharing revenue leak.
https://www.youtube.com/watch?v=rAbNYpgbrz8 - To lighten the mood (Honest streaming service ads)
Source for Population, Internet User Statistics - https://www.statista.com/ and https://www.worldometers.info/
[Disclaimer: I'm not a SEBI Registered Investment or Financial Advisor. All financial topics discussed in this post are for Educational Purpose Only. All information in this article is from personal research and is not intended as, and shall not be understood or construed as , financial advice. It's very important to do your own analysis and reviewing the facts before making any investment based on your own personal circumstances. Kindly seek professional advice before taking investment decision.]