

Evaluating a SaaS Business
Evaluating a SaaS Business
Confused on how to track a SaaS business model ? Not Anymore
Welcome to the 7 Smart Readers who have joined us this month! If you are new here and love to read more about technology and related investment opportunities, join below :
Hi Friends,
We've seen 15 Indian SaaS Unicorns with Investment in SaaS Companies rising to $4.5Bn in 2021 (170% up YoY). This article will be our attempt to simplify the business model of SaaS companies and general metrics we need to track to differentiate wheat from the chaff.
Over the years, we are evolving to new technologies and adopting new business models which is making the life of consumers easier while maintaining or improving the economics of providers. From Landline to Mobile, CDs to PDs to Cloud, 2G to 5G and highlight of this article, from On-Premise Softwares to Cloud based Softwares (SaaS)
Remember the days, when having a licensed latest version of Microsoft office used to be a luxury. However, we had Torrent at our disposal but things were a little tight if you run a company.
Enterprises used to buy software at expensive upfront cost, at the expense of their own infrastructure which also requires upgrades based on software, a technical team to install the software, downtime for servers, support cost, Software version update cost, another downtime and so on. Not to mention the hassle and cost it takes in case they need to switch to a different product.
Enter SaaS, where you are provided a software hosted on a cloud that you can use access online at a fraction of total cost as a subscription. Since, it's a cloud based software, latest features can be rolled out constantly without any downtime and updates, patches, new releases are issued automatically. Without system restart required. Sweet.
From the software provider perspective, it's easier to scale a product that you can sell at a fraction of cost addition to other cost benefits to end users which increase the addressable market for such product. Although, This model gives more freedom for consumers to switch to different product, a recurring revenue model and efficient software ensures a stable cash flow for long period of time.
Now that we've established it is one of superior business model for a IT Industry company, success however depends on various factors including efficiency of product, product placement and execution capabilities of team. With companies stacking on the list of unicorns, there are also growing list at the tail-end getting failed. With that being said, let's move forward to look at some of the quantitative factors specific to this industry that we can look out for which researching a company.
Sales Growth : Winner Takes All
With strong profit pools comes strong competition. Where SaaS has given advantage to software companies to scale their product quickly to masses, it also provide an opportunity for consumers to choose from the best in terms of suitability and economically. We can see clearly in most segments, only few companies cornering the market share in their operating segment.
Social Media - FaceBook, Twitter ; Cloud - AWS, Azure ; E-Commerce - Amazon, Flipkart ; Video Streaming - Netflix, Amazon Prime
Basically, you need to grab as much market share as you possibly can before competition arises in the category or catch-up with your strategy. The market leader enjoys an unfair advantage due to increased interest in product due to network effect, brand perception, reaching economies of scale. A rough cycle of generic SaaS company traced below :

This is reason why most of the tech companies focus on High Revenue growth rather than showing profits sacrificing the peak years of growth.
Rule of 40 is a common metric track by investors in SaaS industry. It considers Revenue Growth + Free Cash Flow Rate, which ideally should be > 40%. A recent study of 200+ companies by McKinsey suggests that businesses exceeded Rule of 40 performance only 16% of the time between 2011 and 2021. This rule ensures the capital efficiency of company that when growth starts to matures, whether company is able to grow its cash flows.
Profitability and Cash Flows
"The thing the surprises many investors & boards of directors about the SaaS model is that, even with perfect execution, an acceleration of growth will often be accompanied by a squeeze on profitability and cash flow "
- Ron Gill , CFO at NetSuite
Usually customers tend to stick to one product for long periods of time if they're happy with the product and the service provider. However, we see strong churn in clients if they're not happy with the product or relationship with provider. Retaining customer is the major variable that plays a part in long term viability of business and its cash flows.
SaaS businesses face significant losses in early years because of heavy upfront investment to acquire the customer. The faster business decides to grow, major the losses are. Below graph shows how cash flows looks like usually on a unit basis.
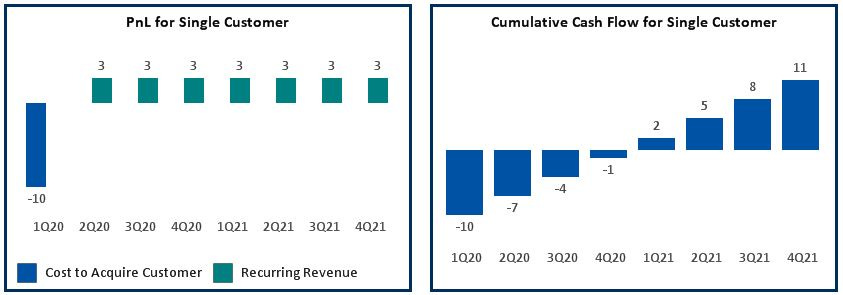
Usually we see companies investing heavily once they see their product buildup and a market to scale, its important to acquire customers at much faster pace considering the growth rate will be more steeper and cash recovery is faster after a sweet spot.

Unit Economics : The Holy Grail
Client Level Unit Economics
There are 3 key factors that decide success rate of a SaaS
Acquiring Customers
Retaining Customers
Monetizing Customers
Two of the most important metrics to consider to track this are
LTV - Lifetime Value of a Customer & CAC - Cost to Acquire a Customer
CAC = Sales & Marketing Expenses / No. of New Customers Added
One of the major expense for SaaS company is sales and marketing expenses.
It generally includes Advertisement Costs, Sales / Marketing Employees Salary, Content Creation Cost, Technical Costs, Sales Overheads.
Point to Note : Some companies might exclude some expenses from CAC which could optically show a better CAC value.
Type of Sales has a major impact on CAC value. Cost increases exponentially as we increase the complexity of sales. Below is the rough estimate of Cost based on Sales Type (as per research from forentrepreneurs.com)

LTV = (ARPA (Average Recurring Revenue per Account) * Gross Margins%) / Net Revenue Churn Rate
This is the commonly used formula by companies based on certain assumptions, this doesn't provide the exact value of LTV but it'll give a rough idea.
Churn
Gross Customer Churn - Number of Customer Lost in a given period
Net Customer Churn - Number of Customer Lost - Numbers of customers added
However, Since not all clients are the same, its better to look at Revenue Churn
Gross Revenue Churn - Total Recurring Revenue Lost from contracts that customers cancelled.
Net Revenue Churn - Total Recurring Revenue lost - Expanded Revenue from Existing Customers - Revenue from New Customers
Up sell / Cross Sell is very important for SaaS to increase revenue per customer for that they need to have more than one products or variable pricing model
Generally, analysts and business consider LTV to CAC ratio to be around 3 : 1 as ideal, as lower than this will suggest unit economics is not viable for long terms and very higher than this could suggest business is not investing enough for growth.
Months to Recover CAC
CAC / (Average Recurring Revenue Per Customer * Gross Margin %)
In Addition to tracking CAC, it's important to see the time period it will take to recover CAC. This will give a sense for how efficiently business is getting monetized and how much capital the business will need at a given time to grow.
Ideally, a mature business should be able to recover CAC in less than 12 months, however, some well funded and high growth business it could take 15-18 Months.
Burn Rate Multiple
Net Burn / Net New ARR
Burn Multiple measures how much a company is deploying in order to generate new ARR. This metric evaluates burn as a multiple of revenue growth. The higher the Burn Multiple, the more the company is burning to achieve each unit of growth. The lower the Burn Multiple, the more efficient the growth is. Above 2-3x is generally considered unsustainable and too aggressive.
Bookings
Bookings can't be tracked the same way as being tracked for IT Services Companies. Different Customers comes with Different Contract Period and Lifetime Value. Hence, bookings can be tracked by tracking New Customers (New ARR) and Existing Customers (Renewals, Expansion, Churned ARR)
Net New ARR = New ARR from new customers + Expansion ARR from existing customers – Churned ARR.
Net Revenue Retention = (Revenue of Renewed Contracts + Expansion ARR) / Total Revenue up for Renewal
This is another major metric to track. If it is > 100 %, it means business is having a negative churn, which is great thing to achieve and ensures that company will be able to grow business every year even without investing in acquiring more customers. It also indicates that customers are happy with the product and looking to expand their usage of product.
Advance Payments
Getting paid in advance has huge positive impact on cash flows if company is able to achieve this without impacting bookings. Getting paid more upfront usually also helps lower churn. This happens because the customer has made a greater commitment to your service, and is more likely to spend the time getting it up and running.
Sales Person Unit Economics
Generally, companies generally don't provide sales person level metrics, however, it's important to track the trends and signs where business model is moving towards.
We already saw above, Type of Sales strategy has significant impact on CAC.
Cost vs ROI
More a business model align its strategy towards high touch or field sales, it becomes more important to look at this metric. It suggests Cost Spend on New Sales vs New Recurring Revenue. Another metric that could be tracked is to see Overall Sales Cost vs Recurring Revenue Trend over time.
Since company have to pay sales from the first day while profits will come after a certain period, It's also important to track the payback time period at sales level.
Gross Sales Efficiency = Gross New Recurring Revenue in current period / Total Sales & Marketing Expense in previous period
Net Sales Efficiency = Net New Recurring Revenue in current period / Total Sales & Marketing Expense in previous period
Using Sales & Marketing Expense of current or previous period is a judgement one has to make considering the sales life cycle of business.
Magic Number
This is another formula that many analysts use for companies where recurring revenue is not disclosed separately. This formula is similar to sales efficiency formula, however, it doesn't include Gross Margin % as we use in CAC formula , and also not considering mix between subscription and service revenue as service revenues are generally lower margin.
Magic Number = (Quarter Revenue This Year - Quarter Revenue Last Year) * 4 / (Sales and marketing expense in Previous Quarter)
Conclusion
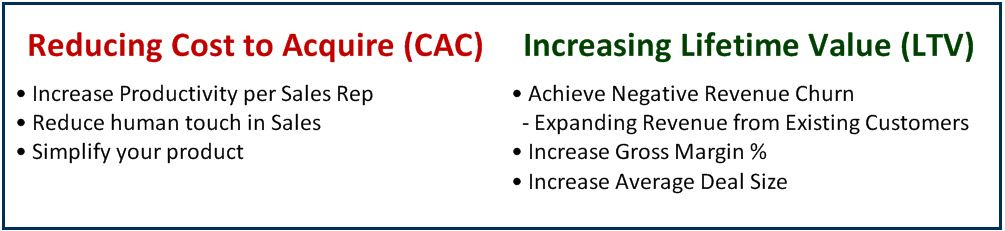
To Summarize these metrics, it all comes down to maintaining the balance between Cost to Acquire Customers and Monetize / Retain the existing Customers.
There are always several factors that change the dynamic of business but tracking these metrics will provide a general perspective about viability of these companies. Some of the information might be unavailable or not directly provided by company but we should look for signs of probable numbers for where the trend is moving. Even though I've majorly focused on quantitative metrics in this article, quality of product and management is just as important, if not more. We'll talk a lot about them in company analysis posts.
P.S. I'm currently reading about 'Rate Gain' and ‘Intellect Design Arena‘. Hoping to soon come up with its business analysis in upcoming post.
Thank you for reading,
Until next time.
If you liked this article, consider sharing it with a friend! You can also comment below or connect me on Twitter with your views and feedback.
Very informative, saved me a lot of time!